
Quicklime DCIM
Data Center Visualization
Visualize your data center with 2D and 3D floorplans. From a world view, to building view, to rack view. Drill down mapping and visualization assists with monitoring your data center and capacity planning
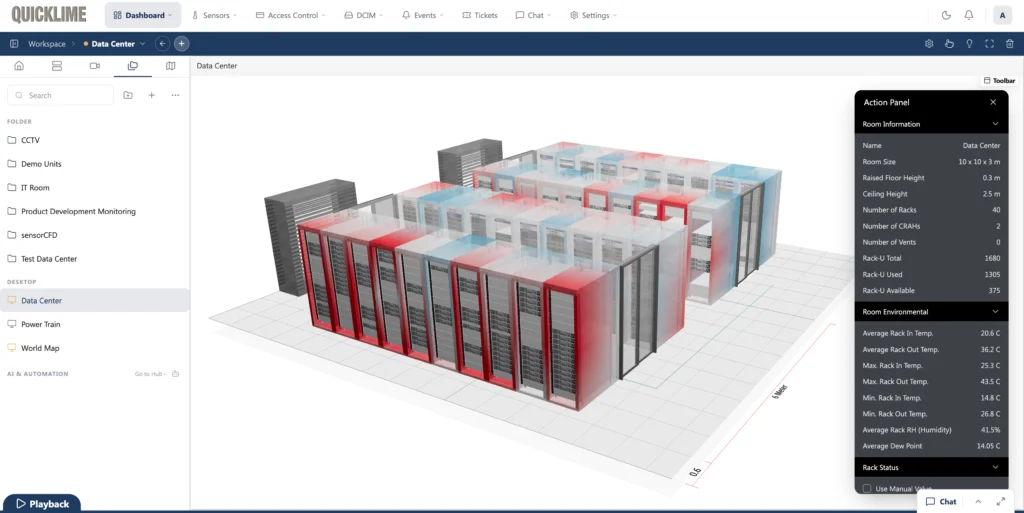
2D and 3D Visualization
Quicklime DCIM software includes built-in drawing tools to quickly layout your data center floorplan, complete with containment, raised flooring, racks and CRAHs. With a click of a button convert the floorplan to 3D and visualize your data center, individual racks colored by status. Drill down to an individual rack, view installed assets, and display AKCP thermal map sensors. Implementing sensorCFD™ displays visual representation of airflow in your data center.
Quicklime DCIM sensorCFD™
sensorCFD™ takes traditional computational fluid dynamics, and adds the ability to constrain the model with live sensor data. The perfect visualization tool for identifying problem areas in your data center.

Quicklime DCIM Rack Maps
Drill down to individual racks and display assets contained in the racks, available U’s, power overhead and installed sensors. This useful visualization tool for capacity planning or troubleshooting hotspots.