
Battery and UPS Monitoring
Monitor UPS Battery and Efficiency
- Monitor Voltage, Amps, and Watts
- Battery Health Monitoring
- Wired and Wireless Sensors
- Graphing, Alerts, and Reports
Monitor battery condition, UPS performance and the environment around your backup power system.
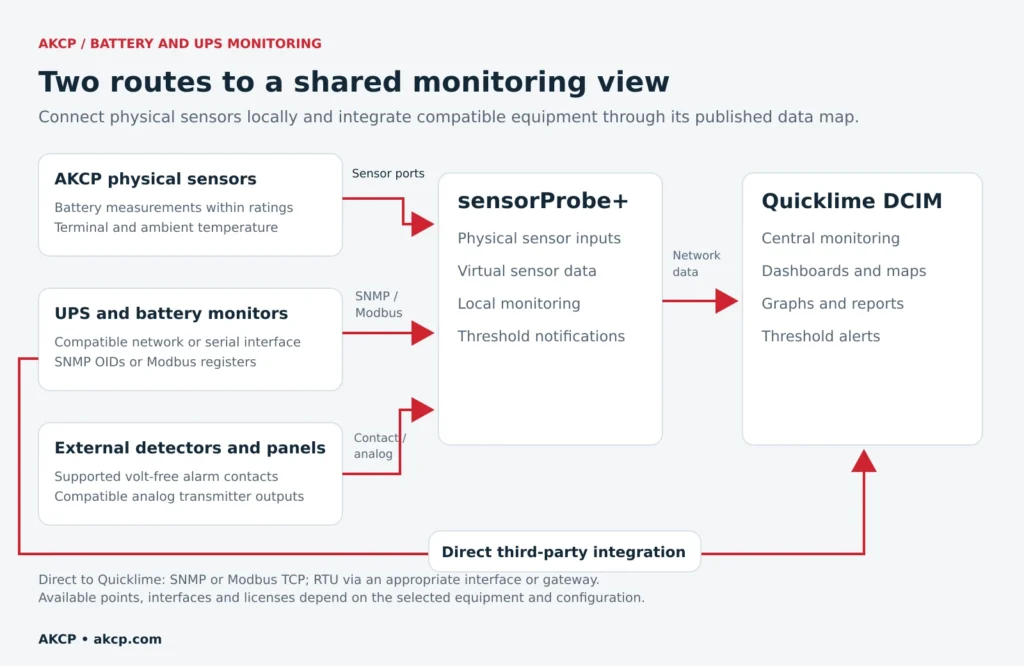
AKCP battery and UPS monitoring combines physical sensors with data from compatible third-party equipment. Connect AKCP sensors to sensorProbe+ and bring in UPS or battery management system data through SNMP or Modbus. Use sensorProbe+ for local monitoring, or Quicklime DCIM to bring multiple devices and sites into a central view.
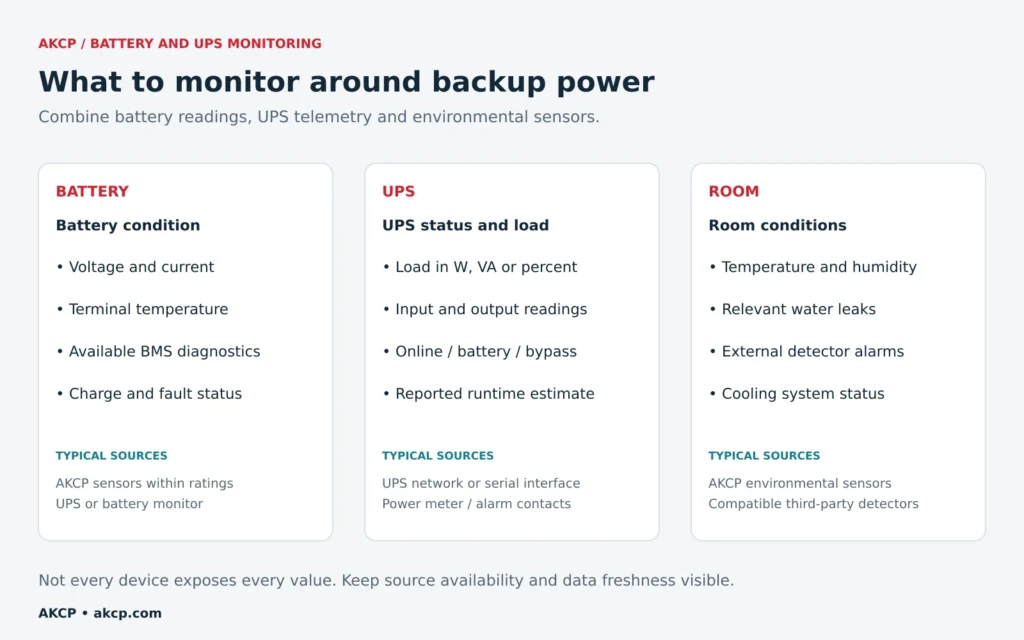
- Battery voltage, current and terminal temperature
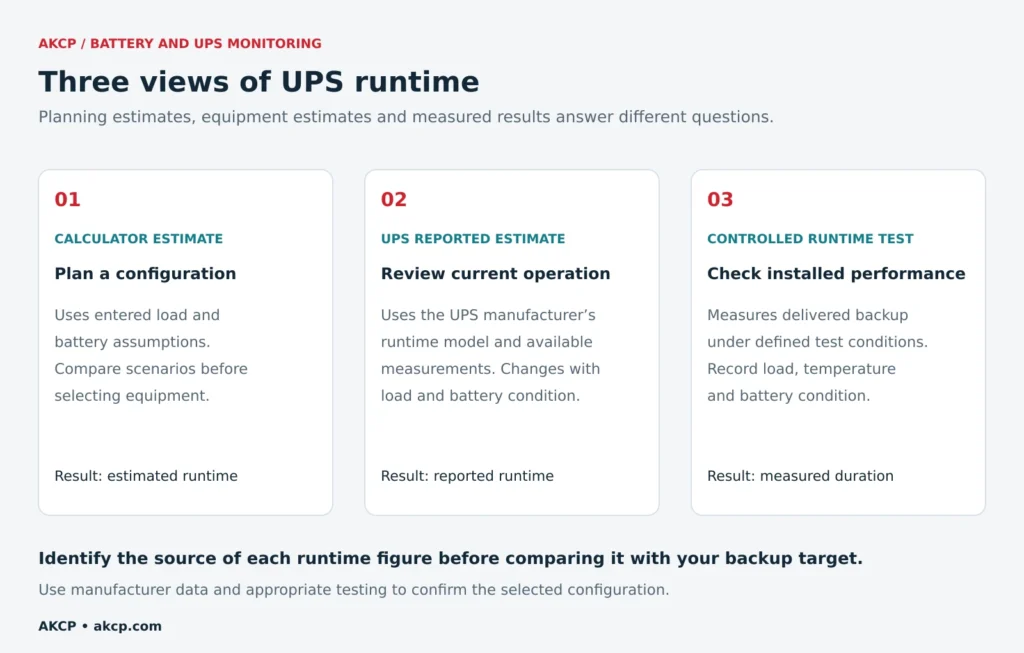
- UPS load, operating status and available runtime data
- SNMP and Modbus integration with compatible equipment
- Threshold alerts, graphs and monitoring across sites
Monitor the battery and the UPS together
A UPS can report that it is online while a developing battery problem remains unnoticed. A room temperature reading can also miss a hot battery terminal. Looking at equipment status and physical measurements together gives your team more context when investigating an alarm.
Build a monitoring view around the questions your operators need to answer. Is the UPS carrying more load than expected? Has a battery temperature changed? Is the system running on battery or bypass? Has a device stopped communicating? These are useful signals for deciding what needs attention.
Battery monitoring with AKCP sensors
Measure battery voltage and current
The AKCP Battery Health Sensor measures voltage, current and terminal temperature on compatible batteries and DC systems. Its voltage input supports configurable ranges up to 60 VDC. Select the appropriate current sensor option for the installation.
Use these readings to establish normal operating values and track changes during charging and discharge. For a UPS battery string above 60 VDC, obtain string measurements from the UPS, a compatible battery monitor or a suitably rated transducer. Direct measurements on individual blocks also require verification of isolation and common-mode ratings for the complete installation.
Monitor battery terminal temperature
The AKCP Battery Terminal Temperature Sensor attaches to the negative battery terminal. It provides a local temperature measurement that complements the ambient sensor in the room. Compare readings over time and investigate terminals that become unusually warm relative to their own baseline or neighboring batteries.
Add visibility to existing battery systems
For compatible DC applications, the AKCP Isolated DC Voltage Sensor provides another voltage monitoring option within its rated input range. Existing battery monitors can provide additional data through their supported interfaces. Internal resistance, impedance, state of charge and state of health are available only when the connected equipment measures and exposes those values; they are not inferred automatically from a voltage reading.
Integrate third-party UPS and battery monitoring
Keep the UPS and battery monitoring equipment you already use. AKCP can collect supported data points through SNMP or Modbus and display them alongside physical sensor readings. Available measurements depend on the equipment model, communication card, firmware and published data map.
SNMP monitoring for network-connected UPS systems
A compatible UPS network card exposes measurements and status through SNMP object identifiers, or OIDs. Configure SNMP GET virtual sensors on a supported sensorProbe+ device, or monitor the equipment directly in Quicklime DCIM. Map each selected OID to the correct name, unit and alarm meaning.
Modbus monitoring for UPS systems and battery monitors
Use Modbus TCP over Ethernet or Modbus RTU over RS485 to read supported registers from UPS systems, battery monitors and power meters. A suitably configured sensorProbe+ can collect Modbus values as virtual sensors. Quicklime can also integrate compatible Modbus equipment; serial devices need an appropriate supported interface or RTU-to-TCP gateway.
For each data point, confirm the register address, data type, scaling, units and status codes. sensorProbe+ protocol support, RS485 hardware, firmware and virtual sensor licenses must match the intended configuration.
Monitor alarm contacts and external detectors
Where a UPS provides volt-free alarm contacts, connect them to suitable AKCP dry contact inputs for states such as a common fault or on-battery alarm. Compatible third-party transmitters and alarm panels can also supply signals through supported analog inputs, dry contacts, SNMP or Modbus.
Monitor the battery room and UPS environment
Add temperature and humidity monitoring around the UPS and battery cabinets. Where relevant, monitor cooling-water leaks and equipment alarm contacts. Environmental readings help operators understand whether an equipment alarm coincides with a change in room conditions.
For lead-acid installations, hydrogen detection may be part of the battery room design. Integrate readings or alarm outputs from an appropriately selected third-party detector. Lithium-ion installations require monitoring suited to the battery chemistry and the manufacturer’s protection system, including available BMS alarms and specialist detection where specified.
AKCP provides operational visibility alongside the installed protection systems. Gas and fire detection, ventilation and protective shutdown remain the responsibility of the dedicated systems selected for the facility.
UPS Load & Runtime Calculator
Check UPS capacity, allow for growth, and estimate how long your batteries can support the load.
Illustrative starting values. Replace them with measured load and your UPS specifications. Calculations run in your browser; this widget sends no data.
1. Load & UPS capacity
2. Runtime calculation
Use the rating of one battery or module. Series adds voltage; parallel strings add Ah capacity.
Lead-acid rate assumptions
Additional battery-side power loss
Enter at least two points for the same UPS, battery configuration, temperature and battery condition. One line per point: load in W, runtime in minutes. Placeholder values are examples, not manufacturer data.
Interpolates between adjacent points on a log-log scale. No extrapolation. Battery factors above do not apply to this mode.Estimated runtime at planned load
Capacity planning
Minimum output ratings at your chosen planning ceiling:
—Both W and VA ratings must be satisfied. These figures do not size batteries or establish redundancy.
What if the load changes?
| Load | W | Runtime | Check |
|---|---|---|---|
| Enter valid inputs. | |||
How this calculator works
Real power: W = VA × load power factor. Planned load = connected load × (1 + growth / 100). Minimum UPS ratings = planned W and VA divided by the planning ceiling fraction.
Battery energy E = battery V × battery Ah × series count × parallel count. Battery-side power P = planned W / efficiency + fixed DC overhead. Runtime (minutes) = 60 × E × health × usable window × rate factor / P. Percentage factors are converted to fractions.
For lead-acid, current per string I = P / (battery V × series count × parallel count). Rate factor = min[1, (Ah / rating hours / I)^(Peukert exponent − 1)]. This approximation reduces available energy at high discharge rates and caps low-rate capacity at nameplate energy. It uses constant nominal voltage; it does not simulate voltage sag or changing discharge current.
Runtime-data mode uses piecewise log-log interpolation of the points you enter. It does not add efficiency or aging adjustments, and returns no estimate outside the supplied load range. The headline runtime rounds down to whole minutes; target checks use the unrounded estimate.
Neither method models temperature, individual weak cells, inverter cutoff, BMS current limits, transient loads or recharge time. Check manufacturer discharge/runtime curves and validate critical loads with a controlled test. Bank counts describe an existing approved configuration; they are not instructions to alter battery wiring.
References: Eaton UPS runtime curves · Battery capacity and Peukert's law
Track actual load, battery condition and runtime trends alongside your data center monitoring. Explore AKCP monitoring solutions.
UPS Battery Sizing Calculator
Find the constant-power rating your batteries need, then compare it with a manufacturer's discharge table.
Starting values are illustrative. Use specifications for your UPS and batteries. This widget calculates in your browser and sends no inputs.
The calculator is starting. If inputs do not appear, its JavaScript may have been blocked.
1. Load & runtime
2. Efficiency & design allowances
UPS output limits & fixed losses
3. Battery configuration
Cutoff voltage & configuration limits
Describe a manufacturer-approved configuration. Increasing battery count does not establish UPS compatibility.
4. Compare a battery datasheet
Optional. Use the constant-power table for your exact battery model. Do not enter Ah or a nominal Wh rating here.
Required rating per battery block
Bank & UPS checks
—
—
—
Output ratings and battery ratings are separate checks. Extra batteries cannot increase a UPS's W or VA limit.
Datasheet comparison
Enter a rating to compare.
—A watts-based comparison does not predict an exact runtime or convert a battery rating into Ah.
Compare parallel strings
| Strings | Blocks | Required W/block | Rating margin | Check |
|---|
Method, assumptions & references
Planned W = connected W × (1 + growth / 100). VA = W / load power factor. Design duration = required runtime + additional reserve minutes. Runtime determines which discharge-table column you use; it does not change the instantaneous load.
Actual DC demand = planned W / battery-mode efficiency + fixed DC overhead. Design battery power = DC demand × (100 / remaining-capacity %) × temperature correction × (1 + additional design margin / 100).
Required W/block = design battery power / (blocks in series × parallel strings). Required W/cell = W/block / cells per block. A datasheet W/cell rating is multiplied by cells per block. Minimum strings = design battery power / (series blocks × datasheet W/block), rounded up to a whole string.
Manufacturer ratings must cover at least the design duration and must be taken at an end voltage no lower than the required cutoff. A longer-duration or higher-cutoff rating is treated as conservative. If the entered rating does not cover these conditions, no capability or minimum-string comparison is shown.
Aging, temperature and design allowances are separate multipliers. For example, 80% remaining capacity produces a 1.25 aging multiplier. Apply temperature correction from the manufacturer's rating temperature to your design conditions; no universal temperature curve is assumed. Do not apply an allowance twice if it is already included in the datasheet rating. The aging multiplier is a planning approximation, not a guarantee of aged high-rate performance.
Assumes fully charged, matching batteries and ideal load sharing. Constant-power tables already account for discharge rate; no additional Peukert correction is applied. No lithium BMS limits, charging voltage limits, charger sizing, recharge time, transient load, cable losses or weakest-cell behavior are modeled. Values are for planning; confirm the complete system with the UPS and battery manufacturers.
References: EnerSys battery application manual · C&D UPS battery sizing
Track actual UPS load and battery conditions alongside your data center monitoring. Explore AKCP monitoring solutions.
UPS Shutdown Timing Calculator
Check whether your shutdown sequence can finish before the runtime budget expires, while preserving a safety reserve.
Illustrative inputs. Use runtime at the actual load and a tested shutdown duration. This is a planning tool; it does not monitor or control equipment.
1. Available runtime
Enter the total battery runtime available when the outage begins.
2. Shutdown sequence
Enter each delay once. If your tested shutdown duration already includes command delays, set the separate control delay to zero.
Latest safe time to issue the shutdown command
Runtime budget check
—
—
—
These are timing budgets, not battery state-of-charge percentages or an automatically applied UPS alarm setting.
Shutdown timeline
Dashed line: end of the adjusted runtime budget. The final green section, when present, is spare time beyond the requested safety reserve.
| Milestone | Time from reference |
|---|
Method & assumptions
All calculations use seconds. Adjusted runtime A = max(0, entered runtime − reading age) × (1 − reduction / 100). Reading age is used only in current-reading mode. Outage-planning mode starts at the moment battery operation begins.
Let D be future detection delay, H planned hold, C control delay, S shutdown work and F safety reserve. The plan needs D + H + C + S + F. Latest command time is A − C − S − F. Maximum hold after detection is A − D − C − S − F. Margin beyond the reserve is A − D − H − C − S − F.
In current-reading mode, the reference is now and detection delay is excluded because the reading is already available. Enter only remaining future delays and work. The minimum fresh runtime reading is (D + H + C + S + F) / (1 − reduction / 100). An older entered reading must also cover its age. Latest permissible times round down to whole seconds; required durations round up.
The model treats the entered runtime as a fixed time budget at a constant load. Load changes, battery faults, temperature changes, revised UPS estimates, early outlet-group power-off and loss of the control network can shorten the available time. The chart is a static plan, not a countdown or a live alarm.
Use the longest dependent shutdown path rather than summing tasks that run in parallel. Include any vendor-required shutdown allowances within the entered durations/reserve. Test the complete sequence, including the UPS, shutdown software and network equipment needed to deliver commands.
Reference: Schneider Electric: available runtime and shutdown duration. Vendor-specific rules can include additional allowances; this calculator does not reproduce every vendor's shutdown algorithm.
Monitor UPS load, reported runtime and battery conditions alongside your data center equipment. Explore AKCP monitoring solutions.
UPS Efficiency & Cost Calculator
Compare two UPS systems or operating modes at the same output load. Calculate electricity losses, heat output and potential annual savings.
Starting values are illustrative. Use efficiency at the actual load and operating mode, not a headline peak value. Calculations run in your browser; this widget sends no inputs.
1. Load & electricity price
2. Compare UPS efficiency
Use AC-input-to-AC-output efficiency for normal operation. Efficiency already includes losses within its measurement boundary; do not add those losses again.
Optional real-power rating checks
3. Optional cooling electricity
Includes only cooling attributable to UPS losses. IT-load cooling and other facility loads are excluded. Do not also multiply these results by PUE.
4. Optional investment & emissions
Annual electricity savings with UPS B
Annual overhead electricity cost
UPS losses plus optional cooling of those losses. Excludes electricity delivered to the protected load. Bars are scaled to the higher cost.
Investment comparison
—
Enter an extra investment to estimate simple payback.
—
Energy-cost comparison only. Maintenance, battery replacement, financing, tax, demand charges and differences in protection performance are excluded.
Emissions estimate
Enter a grid emissions factor to estimate the change.
Based on modeled electricity savings, not a full equipment life-cycle assessment.
Detailed comparison
| Measure | UPS A | UPS B | Difference |
|---|
How the calculator works
Efficiency η = output power / input power. For each system: input kW = output kW / η; loss kW = input kW − output kW. Loss heat is approximated as loss kW, with 1 kW = 3,412.142 BTU/h. For example, 100 kW output at 97% efficiency needs about 103.09 kW input and produces about 3.09 kW loss heat.
Annual UPS electricity = input kW × operating hours. Annual UPS loss electricity = loss kW × operating hours. If cooling is included: cooling kW = loss kW × cooled heat fraction / COP. Electricity cost = kWh × tariff. Total modeled cost includes UPS input electricity and only the optional cooling attributable to UPS losses.
Annual savings = cost A − cost B. Simple payback = extra investment / positive annual savings. Period savings = annual savings × years; net period savings subtract the extra investment once. Grid emissions savings = annual energy savings × the entered kg CO₂e/kWh factor. Changing currency does not convert the tariff or investment.
Assumes constant output load, fixed efficiency at that operating point, fixed tariff and fixed cooling COP. For a changing load profile, calculate separate periods using the matching efficiencies and sum their annual energy/costs. An average of efficiency percentages is not generally equivalent to energy-weighted efficiency.
The model excludes operation outside entered hours, separate standby/no-load losses, battery recharge events, battery-mode periods, demand charges and unrelated facility energy. Do not use battery-mode efficiency for annual normal-operation costs. Heat is an approximate operating-point loss calculation, not a replacement for manufacturer HVAC design data.
A higher-efficiency operating mode may have different transfer behavior, power conditioning and protection characteristics. Compare those requirements as well as energy costs. An optional kW rating check does not establish full UPS compatibility.
References: Schneider Electric: UPS efficiency · Eaton: efficiency and ownership costs.
Track power and UPS operating conditions alongside your data center monitoring. Explore AKCP monitoring solutions.
UPS Battery Recharge Time Calculator
Estimate the time to restore a selected battery charge level using the current available to the battery and an allowance for charging taper.
Planning approximation, not a charger simulation. All starting values and battery-type presets are illustrative. Use measured charging data or manufacturer specifications for your system. This widget sends no inputs.
1. Battery bank
2. Current available for charging
If entering measured net current into the battery, use 100% availability and zero diverted current to avoid deducting the same load twice.
3. Charging assumptions
Approximate time to selected SOC
Bank configuration
—
—
Series adds voltage, not Ah. Parallel adds Ah. More parallel strings can lengthen recovery if total charging current stays the same.
Charging stages to your target
—
Two average-current stages; this is not a measured charging curve.
Recovery window
Enter a recovery window to compare.
Reaching a charge percentage does not establish the runtime available for a second outage. Check runtime at the actual load separately.
Time to common charge levels
| Target SOC | Charge to restore | Estimated time | Status |
|---|
Method, assumptions & references
Bank capacity C = battery Ah × parallel strings. Nominal bank voltage = battery V × series count. Starting/target SOC are fractions of the entered capacity basis. Nominal Wh is descriptive and is not the energy used to charge the bank.
Available charger current = charger DC amps × availability fraction − diverted DC load amps. If a known actively enforced battery-current limit is entered, net charging current is capped at that limit. A nonpositive available current cannot replenish a higher SOC target.
Let x be starting SOC, y target SOC and b bulk-to-taper transition, each expressed as a fraction. Bulk Ah to restore = C × max[0, min(y,b) − x]. Taper Ah to restore = C × max[0, y − max(x,b)]. Bulk hours = bulk Ah / (net bulk current × Ah efficiency). Taper hours = taper Ah / (net bulk current × taper-current fraction × Ah efficiency). Add the startup delay only when charge needs to be restored. Displayed completion times round up to whole minutes.
The presets are editable demonstration values: lead-acid uses 80% transition, 25% average taper current and 90% Ah efficiency; lithium uses 95%, 50% and 99%. These are not universal battery specifications. Replace them with data for the actual battery, charger, temperature and load. An average taper current for one SOC interval may not apply to another, so the milestone table is approximate.
The model does not simulate absorption-voltage control, individual-cell balancing, precharge after deep discharge, charger timer/termination rules, temperature restrictions, changing loads, recharge algorithms or unexpected BMS interruptions. At a 100% target, use the manufacturer's completion criteria rather than treating the estimate as proof of full charge. SOC also does not describe battery health.
Only known current limits are modeled. Do not increase charging current or alter battery wiring based on this calculator. The entered configuration and charging profile must be approved for the UPS/battery system. For critical recovery planning, validate against manufacturer recharge curves or a measured recharge test.
References: Victron: charging stages and recharge time · Eaton: lithium UPS charging limits.
Monitor UPS operating conditions, battery temperature and available charging data alongside your data center equipment. Explore AKCP monitoring solutions.