Home » AKCP Blog » Quicklime Power Train
Maximizing Data Center Resilience: The Impact of Intelligent Power Monitoring
In contemporary data centers, power transcends its role as a mere utility; it is integral to operational efficiency and constitutes one of the most significant operational expenditures. As densities escalate and infrastructure grows increasingly intricate, merely confirming that the power is functional is inadequate. Attaining optimal availability and energy efficiency necessitates detailed visibility, extending from the utility entrance to each individual server. The AKCP Quicklime Power Train feature is meticulously designed to address these gaps by offering a thorough, visual representation of a facility’s electrical hierarchy. This allows operators to monitor the complete power pathway, optimize phase balance, evaluate efficiency through PUE metrics, and sustain high uptime via proactive simulations.
In the modern data center, power is more than just a utility; it is the lifeblood of operations and one of the largest operational expenses. As densities increase and infrastructure becomes more complex, simply knowing that the “lights are on” is no longer sufficient. Achieving high availability and energy efficiency requires granular visibility from the utility entrance down to the individual server.
The Critical Need for Power Visibility
Without detailed power monitoring, data center managers often operate in a “blind spot.” This leads to two primary risks: inefficient energy use and unexpected downtime. Inefficient use often manifests as poor Power Usage Effectiveness (PUE), where a significant portion of energy is consumed by cooling and infrastructure rather than IT equipment. On the other hand, downtime is frequently caused by overloaded circuits or unbalanced phases that trip breakers during peak loads.
Bridging the Gap with AKCP Quicklime Power Train
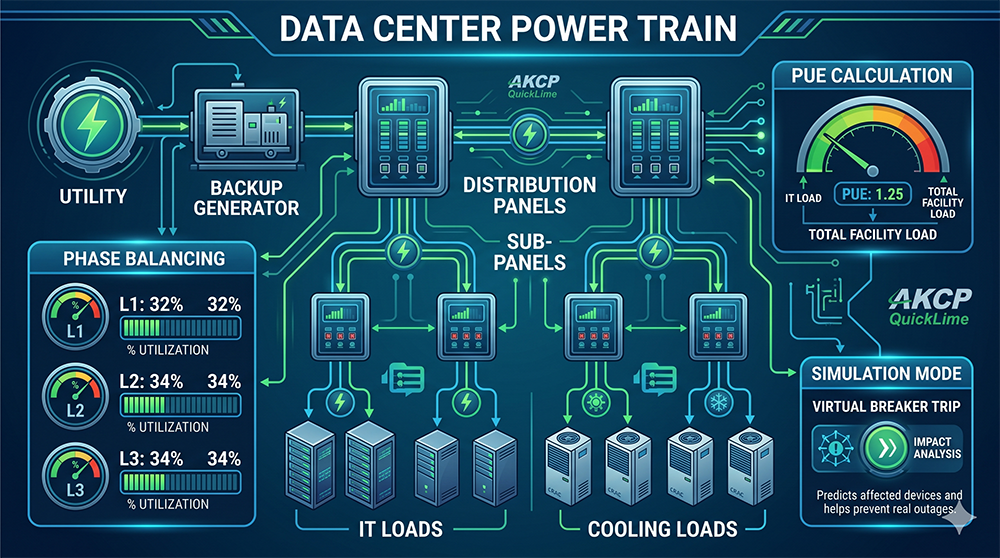
The AKCP Quicklime Power Train feature is designed to eliminate these blind spots by providing a comprehensive, visual map of a facility’s electrical hierarchy. It allows operators to monitor the entire path of power—from main utility lines and backup generators to sub-panels, PDUs, and individual IT loads.
1. Strategic Phase Balancing
One of the most valuable aspects of the Power Train feature is the ability to monitor three-phase power systems (L1, L2, and L3) in real-time. If one phase is heavily loaded while others remain underutilized, the risk of a breaker trip increases even if the total capacity is within limits. Quicklime allows managers to identify exactly which phase has the overhead to support new equipment, ensuring a balanced and stable system.
2. Simplified Data Consolidation
A common hurdle in power monitoring is the cost and complexity of installing meters at every single junction. Quicklime addresses this through intelligent data consolidation. By placing meters at the termination points (such as individual servers or PDUs), the software can automatically calculate and feed the power data back up the hierarchy. This “bottom-up” approach provides a complete view of the power load at every intermediate breaker and panel without requiring redundant hardware.
3. Real-Time PUE and Load Classification
Efficiency cannot be improved if it isn’t measured. The Power Train feature allows users to classify assets, such as distinguishing IT equipment from cooling systems. By categorizing these loads, the system automatically calculates the PUE, giving operators a clear, live metric of their facility’s efficiency and the impact of environmental changes.
4. Simulation and Troubleshooting
Beyond day-to-day monitoring, the Power Train includes a Simulation Mode. This tool is essential for risk assessment, allowing operators to “trip” a virtual breaker to see exactly which downstream assets would be affected. Combined with dry contact sensors that monitor physical breaker status, this ensures that if a failure does occur, technicians can be dispatched to the exact location immediately, significantly reducing Mean Time to Repair (MTTR).
Conclusion
As data centers evolve to handle AI workloads and higher densities, the margin for error in power management continues to shrink. Tools like the AKCP Quicklime Power Train provide the necessary visibility to optimize phase balance, track efficiency via PUE, and maintain high uptime through proactive simulation. By transforming raw electrical data into an actionable visual map, data center managers can ensure their infrastructure is as resilient as it is efficient.
- About the Author
- Latest Posts

For over two decades at AKCP, I have been focused on a single mission: bringing complete visibility, security, and efficiency to the world’s critical infrastructure.
I believe that in the modern data center, AI is only as good as the data it receives. My goal is to ensure facilities have the precise sensor facts needed to control AI opinions, ultimately reducing PUE, releasing stranded capacity, and ensuring maximum uptime.