Thermal Mapping for Data Centers
Thermography refers to the use of a thermal imaging device to detect the radiated heat from an object or hot spots in the data center. Thermography has been around for some time and usually in the security industry, the medical industry, and military applications.
Thermography detects heat and converts it into an image that you can see. This technology is now being employed in data centers. Thermography ensures that various equipment in a facility is running at normal operational temperatures. It also detects abnormal heat patterns that may show issues in the data center airflow.
Thermal Mapping Technology

Thermography is used in various applications and industries, including the following:
- Building diagnostics
- Chemical imaging
- Earth science imaging
- Electrical system monitoring
- Fluid system monitoring
- Law enforcement and security imaging
- Machine condition monitoring
- Medical imaging, which is often used to diagnose diseases
There are many types of infrared thermometers. The basic type of thermometer has a lens that focuses on infrared thermal radiation onto a detector. This radiation is turned into radiant energy that is shown as color-coded signals. Thermometers are designed to measure temperature even from a distance. This prevents the need for close contact with the object being measured.
Below are the three most common types of thermometers used today.
- Infrared Scanner
This thermometer can measure the temperature of larger spaces. It is often used in manufacturing plants with conveyors and those with web processes.
- Spot Infrared Thermometer
This is a handheld radar gun. It is used to detect the temperature of a specific spot on a surface. Spot infrared thermometer is also known as a pyrometer. It is ideal for measuring heat on hard-to-reach equipment under extreme conditions. HVAC operators often use a pyrometer to check the temperature of a ventilation system. Pyrometer is also used in monitoring electrical rooms, water leaks, and panel boards. It is also used in boiler operation and stream system monitoring.
- Infrared Thermal Imaging Camera
This is used to measure temperature at various spots across a wide space. It creates 2D thermographic images with an advanced type of infrared thermometer. Thermal imaging cameras are software-based systems that show real-time images to be used with other software. This helps improve accuracy and provides more in-depth insights.
Thermal Imaging Uses Color Palettes To Show Varying Temperatures
- Black And White Palette. This is also known as grayscale. It only distinguishes temperature between many levels of gray. Black for the coldest and white for the hottest temperatures.
- Iron Palette. This is the usual color palette in thermal imaging. The coldest areas are shown in black. Slightly hotter areas are in blue and purple. Mid-range temperatures are red, orange, and yellow. White is for the hottest temperatures.
- Rainbow Palette. This shows varying temperatures through different colors. Like the iron palette, it also uses the whole spectrum to demonstrate different temperatures.
Thermal Mapping In Data Centers
Nowadays, data centers need more than just good IT operations. Efficient software and hardware systems are also essential to function at optimal condition. Thermal imaging and thermal mapping can be used to track power consumption, temperature, cooling, and other IT operations. Using IRt is the best for monitoring electrical, cooling, and computing equipment.
In data centers, IRt is used to look for, diagnose, and record issues in the facility. It is used for facility issues with air conditioning systems, loose electrical connections, and worn-out bearings. After fixing these issues, the IRt is used to recheck equipment. Ensuring that all are functioning properly.
Two Categories of Employing IRt
- Cooling Systems and Heat-Generating Equipment – The IRt capture the condition of the cooling system. Thermal mapping is used to gather and present the data collected. It allows for IT management and HVAC professionals to look at heat-related problems of the system.
- Electrical Power Distribution And Mechanical Systems- Monitoring electrical systems is crucial to safe and efficient data center operations. Electrical IRt is the commonly accepted application of IRt technology in data centers. Electrical switchgear, motors, and motor controls need thorough monitoring. HVAC systems, UPS, ATS, and PDU also require in-depth checking. And IRt is here to help do these requirements.
The function of cooling systems is to make way for the cooling air intakes and the return exhaust air to the CRAC units. Facilities are typically designed using computer software. It is then modeled using computational fluid dynamics (CFD). CFD models predict the thermal performance of data centers. Despite advanced computer modeling, CFD is not always reliable. Other aspects of building facilities can affect the thermal conditions in data centers. For instance, under-floor cable and ducting installations can have a significant impact on airflow.
That is why thermal mapping is a useful tool in data centers. Thermal mapping can capture the full thermal conditions of a facility and all its equipment. Offering comprehensive and actual thermal imagery.
Temperature monitors allow you to track the thermal conditions of your facility. You just need to place them on strategic points to maximize their benefits. But thermal imaging brings more advantages. A thermal image can show more than 75,000 temperature points. It is best to incorporate thermal imaging systems with your sensors.
Thermal Mapping Designs In Data Centers
Each area of a data center must be strategically designed. For your thermal map, you need to gather all thermal and visual imagery of your facility. You can make a 2D or 3D model, depending on your needs and preferences.
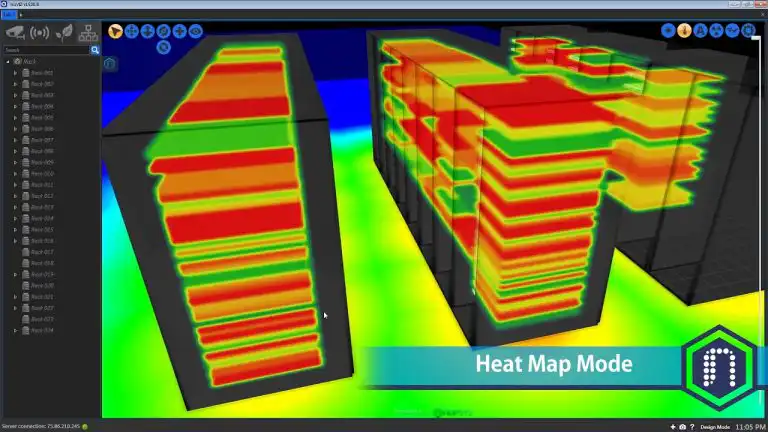
- 2D Thermal Map Of Data Center Server RacksThe figure below shows an example of a thermal map of server racks. The thermal map shows highly intricate front-facing images of servers. The details are more intricate when you use IR and visible images. You can also see the thermal conditions when cabinet doors are open. By employing thermal maps in your facility. You will have a clearer image of the heat generation in your facility. This is a big advantage towards efficiency.
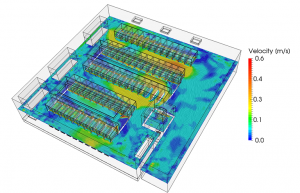
- 2D Thermal Map Of Data Center FloorsA 2D thermal map provides quick access to large spaces of data. The mosaic infrared images (IR) can analyze patterns that may not be clear in single images. The figure below is an example of a 2D thermal map of data center floors.
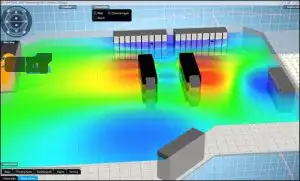
- 3D Thermal Map of Data Center FloorsThe 3D thermal map is the most advanced approach towards capturing thermal conditions. It is also the most powerful of all tools. 3D models can be viewed from any angle. A complete 3D thermal map gives you the big picture of your facility. With 3D maps, professionals can examine your facility without having to be on-site.
Monitoring with AKCP
AKCP is the world’s leading expert on professional sensor solutions. Our R&D centers specialize in SNMP-based networking and embedded device technology. AKCP is the first company to bring a workable, LoRa based wireless monitoring system and wireless tunnel for critical infrastructure to market. With features specifically tailored for the data center.
Wireless Thermal Map Sensor
Monitor the temperature differential between the front and rear of your cabinet. Datacenter monitoring with wireless thermal map sensors helps identify and eliminate hotspots in your cabinets by identifying areas where temperature differential between front and rear are too high.
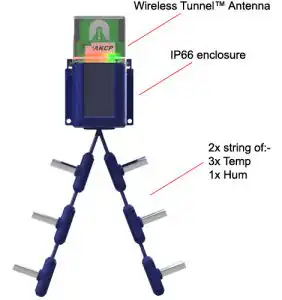
With three (3) temperature sensors at the front and three (3) at the rear, it monitors airflow intake and exhaust temperatures, as well as providing the temperature differential between the front and rear of the cabinet (ΔT) Wireless Thermal Maps work with all Wireless Gateways.
Conclusion
Cooling is an integral part of data centers. Servers and other IT equipment generate heat that needs to be removed in the facility. Nowadays, there are many cooling methods that you can use in your data center to remove heat. But these cooling techniques are not enough. Monitoring temperature and heat waste remain integral aspects of your facility.
Reference Links:
https://www.reliableplant.com/infrared-thermography-31572
https://www.infraredimagingservices.com/wp-content/uploads/2010-188_Stockton_USING_THERMAL_MAPPING_AT_THE_DATA_CENTER_0.pdf
https://www.akcp.com/blog/thermal-mapping-your-data-center/
- About the Author
- Latest Posts

For over two decades at AKCP, I have been focused on a single mission: bringing complete visibility, security, and efficiency to the world’s critical infrastructure.
I believe that in the modern data center, AI is only as good as the data it receives. My goal is to ensure facilities have the precise sensor facts needed to control AI opinions, ultimately reducing PUE, releasing stranded capacity, and ensuring maximum uptime.