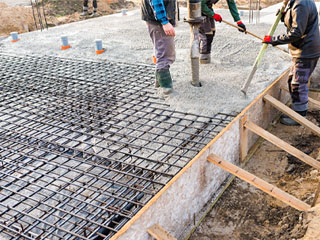

Power Density In the Past
Here’s How it Works
Evolution of Power Density and Data Center Energy Consumption
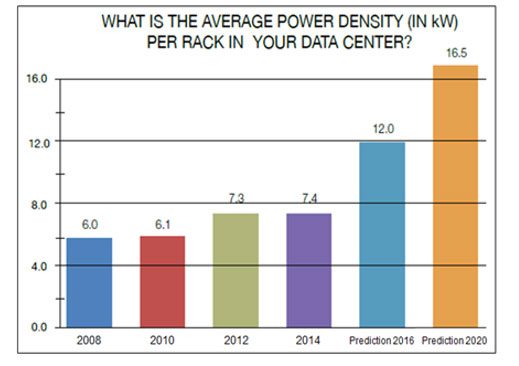
Photo Credit: www.deltapowersolutions.com
Let’s take a look at historical data center energy use.
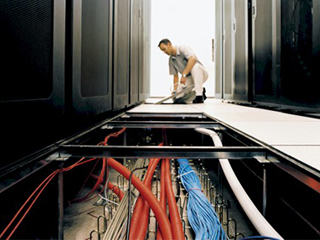
Challenges with Increasing Power Density
Power And Cooling
CPU consumption will grow as real servers become overburdened with virtual machines. The increased power demand can average approximately 20% when these devices go from 5-10% utilization up to 50% of utilization. This power consumption can be increased even further by the additional CPU and memory utilization.
In the data center, virtualization has created several new issues. High-density cabinets now require more power than traditional low-density. Due to the increased power consumption, electricians need to rewire cables to accommodate the capacity load. Or, it is smarter to migrate your load into a much-equipped data center.
Because of the increased power density in data centers as a result of virtualization, cooling issues may arise. High-density machines may generate more heat in a smaller space, making it more difficult to disperse. Hotspots in your data center may come out as a result of this.
AKCP Power Monitoring
AKCP, the world’s oldest and largest supplier of networked wired and wireless sensor solutions, has launched a free online PUE calculator to check your data center efficiency and identify potential savings.
Power Usage Effectiveness (PUE) is a popular metric that measures how efficient your data center operation is. It’s a ratio of the amount of energy spent on cooling vs the amount of energy spent on the IT load. A PUE of 1.0 means your data center runs on totally free cooling. A PUE of 2.0 means you spend an equal amount of energy on cooling as you do on IT load.
A well-designed and run data center can obtain a PUE of 1.2 – 1.3. However, most smaller edge data centers and in-house computer rooms have PUE numbers of 2.0 and above.
AKCPro Server is an ideal DCIM solution. Perfect for those people who don’t have the budget or need for complex DCIM software, but require a capable monitoring system for their data center. With many advanced features such as Cabinet Thermal Mapping, Drill Down Mapping, Graphing, VPN connections to remote sites, AKCPro Server is the ideal choice. AKCPro Server is capable of live PUE calculations, so you can see real-time the effect of the changes you make on your PUE.
Try out our FREE online PUE Calculation Tool here
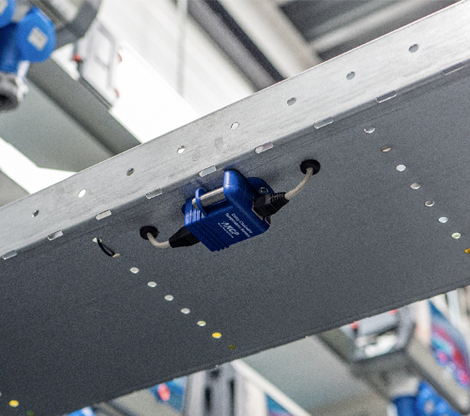
Power Monitoring Sensor
The AKCP Power Monitor Sensor gives vital information and allows you to remotely monitor power. This eliminates the need for manual power audits as well as provides immediate alerts to potential problems. The AKCP Power Monitor Sensor is specifically designed to be used with AKCP sensorProbe+ and securityProbe base units. It has been integrated into the sensorProbe+ and securityProbe web interface with its own “Power Management” menu, allowing multiple three-phase and single-phase Power Monitor Sensors to be set up on a single sensorProbe+ or securityProbe depending on which readings are required. Please check the sensorProbe+ Modbus manual or the PMS manuals on our website for more detailed information on this. Power meter readings can also be used with the sensorProbe+ and AKCPro Server lives PUE calculations that analyze the efficiency of power usage in your data center. Data collected over time using the Power Monitor sensor can also be viewed using the built-in graphing tool.
Avoid Hotspots with AKCP
Airflow Sensor
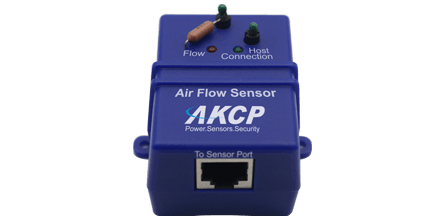
AKCP Airflow Sensors
The AKCPro airflow sensor is designed for systems that generate heat in the course of their operation. So, a steady flow of air is necessary to dissipate this heat. System reliability and safety could be jeopardized if this cooling airflow stops.
The Airflow sensor is placed in the path of the air stream, where the user can monitor the status of the flowing air. The airflow sensor is not a precision measuring instrument. This device is meant to measure the presence or the absence of airflow.
Cabinet Analysis Sensor
Airflow and Thermal Mapping for IT Cabinets
The Cabinet Analysis Sensor (CAS) features a cabinet thermal map for detecting hot spots and a differential pressure sensor for analysis of airflow. Monitor up to 16 cabinets from a single IP address with the sensorProbeX+ base units. The Wireless Cabinet Analysis Sensor is also available using our Wireless Tunnel™ Technology.
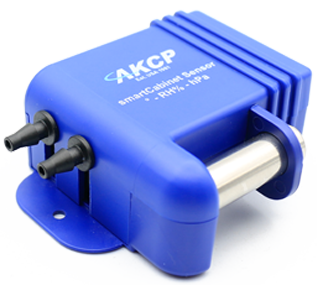
AKCP Cabinet Analysis Sensor
Differential Temperature (△T)
Cabinet thermal maps consist of 2 strings of 3x Temp and 1x Hum sensor. Monitor the temperature at the front and rear of the cabinet, top, middle, and bottom. The △T value, front to rear temperature differential is calculated and displayed with animated arrows in AKCPro Server cabinet rack map views.
Differential Pressure (△P)
There should always be a positive pressure at the front of the cabinet, to ensure that air from hot and cold aisles is not mixing. Air travels from areas of high pressure to low pressure, it is imperative for efficient cooling to check that there is higher pressure at the front of the cabinet and lower pressure at the rear.
Rack Maps and Containment Views
With an L-DCIM or PC with AKCPro Server installed, dedicated rack maps displaying Cabinet Analysis Sensor data can be configured to give a visual representation of each rack in your data center. If you are running a hot/cold aisle containment, then containment views can also be configured to give a sectional view of your racks and containment aisles.