
Datacenter administrators go to great lengths to enhance efficiency, and proper airflow is crucial. Monitoring air temperatures within IT equipment and cooling units is standard practice, but the significance of temperature differentials (Delta T) throughout the data center is often overlooked. This article delves into the concept of Delta T, its impact on data center performance, and effective management strategies to improve Power Usage Effectiveness (PUE).

What is Delta T?
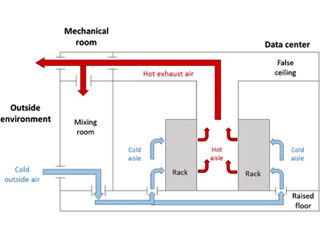
Delta T signifies the temperature variation as air passes through different stages of the data center’s cooling process. It starts as cool air entering IT equipment, which then warms up while absorbing heat from servers. The exhausted air is significantly warmer than the incoming air. Similarly, air returning to the cooling unit cools down, resulting in temperature variations termed Delta T (∆).
Factors Influencing Delta T:
Several factors influence to Delta T, including inadequate airflow, open pathways between hot and cold aisles, air leakage, and unsealed rack slots. Hot air recirculation (HAR) due to improper airflow can lead to hotspot issues and higher operational costs.
The 4 Delta T’s of a Data Center:
- IT Equipment Delta T: The temperature rise of air passing through IT equipment should be around 10°C to 20°C depending on equipment type. Blade servers with higher Delta T consume less airflow (CFM/kW) than “Pizza Box” servers with lower Delta T.
- Cooling Unit Delta T: Efficiency demands that the cooling unit’s air temperature matches the Delta T across IT equipment. Volumetric airflow (CFM) should also align with IT equipment flow rate.
- Supply Air Delta T: The temperature difference between the air leaving the cooling unit and arriving at the rack/server inlet. For maximum efficiency this should be 0°C, meaning non of the cooling energy is lost between the cooling unit and servers.
- Return Air Delta T: Return air temperature usually drops as it reaches cooling units. This contrasts with the practice of returning the warmest air, therefore for maximum efficiency the delta T between the server exhaust and the cooling air intake would be close to 0°C.
There is a simple calculation that can illustrate the difference ∆T can have with different IT equipment.
CFM = (3.16 x Watts) / ΔT
Where :
CFM = cubic feet per minute of airflow through the server
3.16 = factor for density of air at sea level in relation to ⁰F
ΔT = temperature rise of air passing through the server in ⁰F
A Blade server typically runs at higher ∆T. If we consider it consumes 400 Watts of power:
CFM = (3.16 x 400) / 35°F = 36 CFM
A typical pizza box style server runs at a lower ∆T but consumes the same power
CFM = (3.16 x 400) / 20°F = 63 CFM
So although both of these pieces of equipment consume the same power, their CFM cooling requirement is very different. That is why the ∆T is such an important metric. You need to balance the air supply from the cooling system with the demands of the servers. Too much and you waste energy overcooling, too little and servers can overheat.
Managing Delta T:
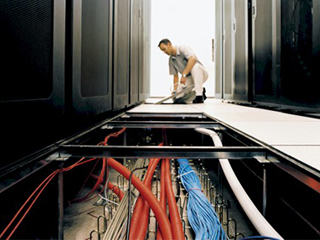
Efficient data centers require meticulous Delta T management. Strategies encompass floor management, filling racks with blanking panels to prevent airflow obstruction, forming proper layouts to separate hot and cold aisles, and addressing potential problems through preventive maintenance.
Temperature Sensors in Delta T Management:
Temperature sensors employing Artificial Intelligence (AI) play a vital role. Placed strategically on racks, they offer insights into temperature differentials and alert administrators if temperature exceeds acceptable ranges.
However, the quality of the sensor and its location affect the accuracy of data. A sensor must have stability, quick response time, built-in calibration, and flexibility.
As for the location, they should be placed on the strategic points on the rack. They can be placed on the top, bottom, back, and center. The ASHRAE recommends using six or more sensors for the most accurate reading.
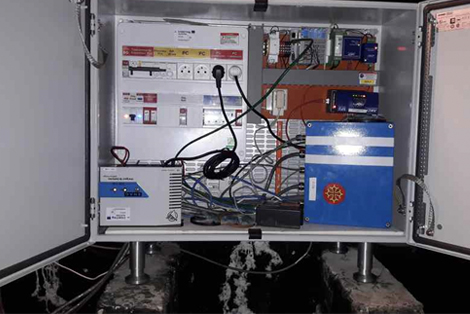
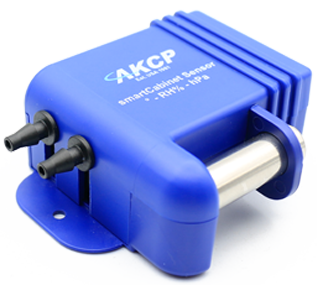
AKCP Cabinet Analysis Sensor (CAS):
AKCP’s CAS, featuring cabinet thermal maps and differential pressure sensors, is an asset in monitoring. Differential Temperature (△T) calculates front-to-rear temperature differentials. Differential Pressure (△P) ensures efficient cooling by maintaining positive pressure at the front of cabinets.
Differential Temperature (△T)
Cabinet thermal maps consist of 2 strings of 3x Temp and 1x Hum sensor. Monitor the temperature at the front and rear of the cabinet, top, middle, and bottom. The △T value, front to rear temperature differential is calculated and displayed with animated arrows in AKCPro Server cabinet rack map views.
AKCP Cabinet Analysis Sensor
Differential Pressure (△P)
There should always be a positive pressure at the front of the cabinet, to ensure that air from hot and cold aisles is not mixing. Air travels from areas of high pressure to low pressure, it is imperative for efficient cooling to check that there is higher pressure at the front of the cabinet and lower pressure at the rear.
Rack Maps and Containment Views
With an L-DCIM or PC with AKCPro Server installed, dedicated rack maps displaying Cabinet Analysis Sensor data can be configured to give a visual representation of each rack in your data center. If you are running a hot/cold aisle containment, then containment views can also be configured to give a sectional view of your racks and containment aisles.
Enhancing Efficiency with PUE:
Power Usage Effectiveness (PUE) measures energy efficiency. Combining CAS data with power consumption data allows informed adjustments to cooling systems while monitoring changes in PUE.