The Real Amount of Energy A Data Center Uses

Clarissa GarciaBlog

data center energy use

In 2020, the data center industry consumed around 196 to 400 terawatt-hours (TWh). This is equivalent to 1% to 2% of worldwide annual data center energy consumption. According to another analysis, data centers in the European Union alone will require 104 TWh in 2020. With the trend for the Data Center industry to continue its expansion, this energy use will continue to grow. The size of these facilities can range from small 100-square-foot to hyper-scale 400,000-square-foot data centers with thousands of cabinets. You connect to one of the millions of servers in one of the thousands of data centers around the world whenever you use any internet service.

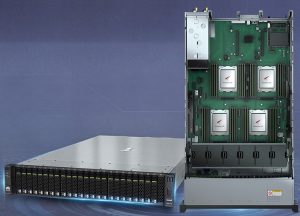
Servers

servers

Photo Credit: huawei.com

As of 2020, there were approximately 18 million servers in data centers around the world, up from around 11 million in 2006. The proportion of maximum power drawn is partially connected to the percentage of maximum power used. Since 2007, the number of CPU sockets has been constant, with 118W for single-socket servers and 365W for two-socket servers.

Understanding the efficiency of servers requires an understanding of power proportionality. This is proportional to the amount of time spent on it. A server that uses 10% of its maximum power will draw 10% of its maximum power if energy proportionality is exact. The ratio between idle and maximum power, which can be influenced by hardware, power management software, and server design, is known as Dynamic Range.

The migration to hyperscale facilities managed by cloud providers has been accompanied by advances in server dynamic range and utilization due to software management systems and the move to hyperscale facilities run by cloud providers. Despite this, the majority of servers are rarely used to their maximum capacity, with the most efficient servers running at only 50% capacity. As of 2020, this equates to 40,000 GWh/year in direct server electricity use in the United States, with half of this being wasted by idle servers.

Storage

Every year, the amount of data generated by humanity increases, necessitating storage on disks. Drive types have different power requirements per disk. The wattage of a hard disk drive (HDD) is not proportional to its capacity and was projected to be 14W/disk in 2006, but has since decreased by 5% every year to 8.6W/disk in 2015. Since 2010, the wattage of a solid-state drive (SSD) has remained constant at 6W/disk, while the wattage per terabyte (TB) has increased, with capacity per watt increasing by 3-4x between 2010 and 2020.

Storage drive wattage in data centers in the United States. The total electricity consumption for disks is anticipated to be just over 8,000 GWh per year for a total of 1,000 million TB of storage in 2020. The number of disks deployed is decreasing, but the total capacity is increasing, with a projected lifespan of 4.4 years.

Network

computer network

Photo Credit: www.cisco.com/

The network component refers to the fact that servers must be connected to each other and to the internet. Depending on the number of ports and their speed, network devices use power.

The energy usage of the internet has been estimated in a variety of ways, ranging from 136 kWh/GB in the year 2000 to 0.004 kWh/GB in the year 2008, although a more recent analysis of calculating approaches found 0.06 kWh/GB for the year 2015. Every two years, this decreases by 50%.

It’s difficult to calculate the internet’s energy usage because Aslan et al. only take into account fixed-line networks in industrialized countries. Mobile networks, which will account for nearly 20% of all internet traffic by 2022 and grow at a rate of 46% per year, and internal data center connectivity, which is expected to double every 12-15 months, are not included in the calculations. Unfortunately, it is difficult to quantify the true energy impact of networking today due to the lack of recent estimates investigating networking equipment speeds up to the current fastest 400Gb devices.

Infrastructure

The infrastructure that supports the servers, disks` and networking equipment that make up the data center is located in the data center building. Cooling, power distribution, backup batteries and generators, lighting, fire protection, and the construction materials themselves are all included. Power Usage Effectiveness (PUE) is a method of calculating the cost of infrastructure. This is the ratio of the infrastructure’s power consumption to the power given to the servers, disks, and networking equipment.

With a PUE of 1.0, the IT equipment receives 100% of the power inputs in the data center. Its average value is 1.67, however, it varies from 1.11 to 3.0.

Although efficiency may not have improved, using the PUE ratio alone has been criticized because it will decline when the IT load increases. As a result, rather than merely indicating efficiency, it is more beneficial to compare facilities. Data centers have environmental implications that go beyond energy: water needed for cooling and the life cycle of IT equipment are two more key aspects that aren’t included in PUE. To better assess genuine impacts, metrics such as Water Use Effectiveness (WUE) and Land Use Effectiveness (LUE), as well as Life Cycle Analysis (LCA), have been suggested.

The fuel-to-server efficiency in a traditional data center is only 17.5%, due to the low efficiency of generating electricity from fossil fuels, which still make up the majority of the energy mix in most power grids, combined with grid losses and losses in the data center’s power distribution systems. Fuel cells have been studied as a way to eliminate these losses, and they have the potential to enhance efficiency to 29.5%.

53.2% efficiency might be obtained by modifying the data center architecture to use direct current (DC) from the fuel cell and bypassing the Uninterruptible Power Supply (UPS).

Cloud Computing

cloud computing

Photo Credit: www.networksunlimited.com

The embodied energy and electricity drawn during the real use of IT equipment can be monitored to determine the environmental impact. Emissions can then be calculated by combining this with data from the data center components. There are criteria for building energy-efficient data centers, and these calculations are part of the Greenhouse Gas Protocol. Many organizations are obligated to submit these sorts of emissions under the GHG Protocol’s Scope 1 and Scope 2 reporting guidelines.

When IT workloads are shifted to the cloud and resources are purchased in small “virtual” units on a pay-as-you-go basis, the accompanying emissions are reported as “indirect” or “outsourced” emissions under the optional Scope 3 reporting system. Because the major cloud vendors Amazon Web Services, Google Cloud, and Microsoft Azure, only disclose aggregated global statistics with varying degrees of transparency, data to calculate real emissions is also no longer available.

Aside from their total carbon footprint of 44.4 million tCO2e in 2018, Amazon is the least transparent, reporting very little environmental information. This isn’t a helpful figure because it encompasses all of Amazon’s activities and doesn’t break down the cloud business. In a Greenpeace investigation, Amazon was chastised for its lack of transparency.

There is a need for cloud vendors to be honest about their environmental impact, with 53% of servers predicted to be in hyperscale facilities by 2021 and the market rising from $6 billion in 2008 to $288 billion in 2019.

The cloud, on the other hand, isn’t all bad. As a result of their scale, hyperscale providers may justify initiatives such as Google building its own servers and Microsoft building the world’s first gas data center, which all help to energy efficiency.

Also, the IT industry is the largest purchaser of renewable energy, and Microsoft unveiled a GHG Protocol-compliant sustainability calculator in January 2020, allowing customers to quantify their unique cloud carbon footprint. All cloud providers should take a similar strategy.

Efficiency Challenges Ahead?

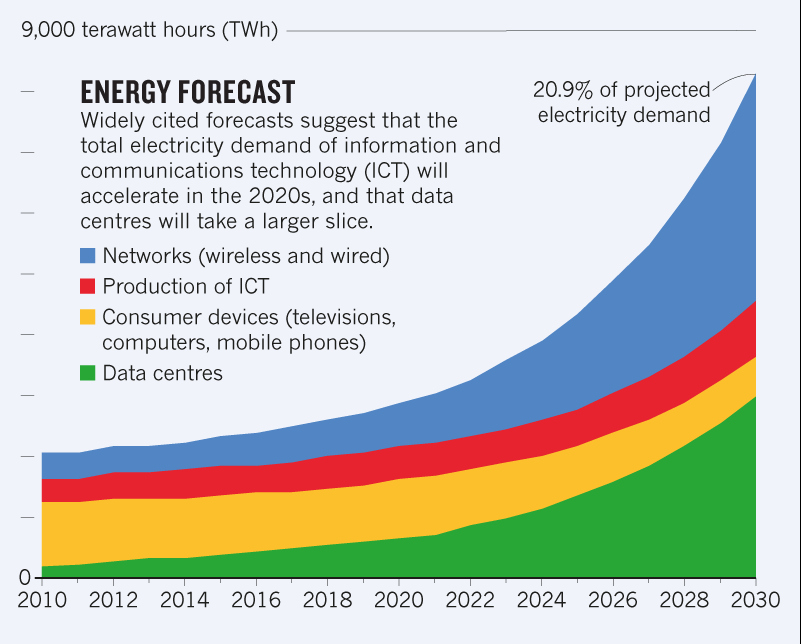
Despite the fact that the last two decades have witnessed significant advances in inefficiency, there are signs that this may be coming to an end. Datacenter energy usage is expected to quadruple by 2030 as a combination of market growth and diminishing returns from existing approaches to efficiency improvements. If non-renewable electricity continues to be a major source of data center energy, data center emissions could surpass those of the aviation industry, which presently accounts for 2% of global CO2 emissions.

In the past, energy forecasts for data centers have been incorrect, although developments such as data centers powered by fuel cells look promising. However, if efficiency does not improve, we may see a rise in worldwide electricity use of 3% to 13% by 2030. Several situations could come together to stymie future progress:

  • Every 1.5 years, according to Moore’s Law, the performance per watt of a CPU double. It’s possible that big efficiency gains will be overlooked if data center gear is only updated every 4.4 years. This also assumes that Moore’s Law will continue to apply, which is a possibility. The physical restrictions of ever-smaller chips are becoming increasingly difficult to break through. How will other environmental metrics like embodied energy and waste be affected if replacement cycles become more frequent?
  • The creation of new types of chips for specialized uses, such as telecommunications, Machine learning, and graphics processing units (GPUs) could demand more power, but their efficiency profiles are unclear. What will be the efficiency profile of these chips, and will we witness increases in performance per watt that have been seen in the past?
  • Hyperscale data centers, such as Google’s Finland data center, are frequently located in areas where renewable energy is available. These sites, on the other hand, are often far from major cities, resulting in longer network response times as data must travel further to the end user. The demand for low latency will necessitate data centers to be located closer to the user as urbanization expands, yet these sites may be less suited for accessing renewable energy sources or natural water sources for cooling. Can gas fuel cells help to reduce this?

Methods Of Measuring Data Center Energy Use

At the national and global levels, no official figures on data center energy use are currently available. As a result, to determine the amount of energy used, mathematical models must be used. To arrive at an estimate of overall energy use, so-called “bottom-up” models take into consideration the installed stocks of IT devices in various data centers, as well as their energy consumption characteristics. Bottom-up research provides a wealth of information about the determinants of energy consumption, but it requires a lot of data and time, so it doesn’t happen often. Data centers accounted for between 1.1 and 1.5%of worldwide electricity consumption in 2010, according to the most authoritative bottom-up assessment in the recent decade.

Extrapolation-based models, on the other hand, predict total energy use by scaling up previous bottom-up estimates based on data center market growth indicators such as worldwide IP traffic or data center investments. Extrapolation-based procedures have been utilized to fill in the gaps left by intermittent bottom-up investigations since they are simpler.

Given that the market indicators on which they are based are likewise growing rapidly, such extrapolations tend to forecast huge increases in data center energy demand. By extending this historical reasoning, some oft-cited extrapolations have predicted that global data center energy may have doubled since 2010 and that it will continue to rise rapidly in the future. These figures have gotten a lot of press, confirming the prevalent view that data center energy use is increasing at a faster rate than the demand for data.

Although demand for information services has increased dramatically in recent years, new bottom-up data shows that global data center energy use increased only by 6% between 2010 and 2018. In comparison to previous research, these new findings were based on the integration of a number of recent statistics that better characterize the installed stocks, operating characteristics, and energy consumption of data center IT equipment, as well as structural alterations in the data center business.

In contrast to earlier extrapolation-based estimates that indicated rapidly expanding data center energy use over the last decade, the result that worldwide data centers likely consumed roughly 205 terawatt-hours (TWh) in 2018, or 1% of global power use, is starkly different.

This near-plateau in energy use is attributable to three main efficiency effects: first, thanks to ongoing technological improvement by IT manufacturers, the energy efficiency of IT devices—particularly servers and storage drives—has significantly improved. Second, the increased use of server virtualization software, which allows numerous programs to operate on a single server, has resulted in a significant reduction in each hosted application’s energy consumption. Third, the majority of compute instances have moved to the large cloud and hyperscale data centers, which, among other things, use ultra-efficient cooling systems to save energy.

Because of the absence of technological and structural information in extrapolation-based approaches, these efficiency impacts are not properly recorded. The top half shows the drivers of data center demand that push energy use up, but the lower half shows strong countervailing efficiency trends that keep energy use in check.

What About CO2 Emissions?

Data centers require a lot of electricity, which raises worries about their carbon dioxide (CO2) emissions. Due to a lack of data on the locations of the vast majority of worldwide data centers and the emissions intensities of their real electricity sources, it is currently impossible to reliably estimate the overall CO2 emissions. Only a few businesses, including Google, Apple, Switch, and Facebook, make such information public, showing a rising trend among the world’s largest data center operators toward renewable energy procurement.

Knowing how much electricity is used by worldwide data centers, on the other hand, is a good way to assess assertions regarding the impact of data center services on CO2 emissions. A common assertion is that data centers in the world emit as much CO2 as the worldwide aviation sector, which is around 900 billion pounds of CO2. Given that global data centers recently consumed over 205 billion kWh, their average power emissions intensity would have to be roughly 4.4 kg CO2/kWh for this claim to be correct.

Despite this, the average coal-fired power plant, which is the most carbon-intensive alternative, emits less than one-fourth of this amount—around one kilogram CO2/kWh. It’s also evident that not all of the world’s data centers are powered by coal, especially given that some of the world’s largest data centers are using renewable energy, which accounts for a growing share of global computing instances.

Another recent allegation is that “viewing 30 minutes of Netflix (1.6 kg of CO2) emits the same amount of CO2 as driving nearly four miles.” This claim is backed up by estimates that Netflix streaming data centers utilize roughly 370 TWh per year. However, this figure is 1.8 times greater than the anticipated 205 TWh for all of the world’s data centers, which supply society with a wide range of information services beyond Netflix video streaming.

Measuring The Power Usage Effectiveness Of Data Centers

The ratio of how much energy you use to run your IT systems to how much you use for cooling, lighting, and other building services is known as the Power Effectiveness Usage (PUE). A PUE of 1 indicates that you are operating at maximum efficiency, using no energy for cooling, lighting, other non-IT systems. In most cases, a PUE of 1.5 to 1.8 is regarded to be effective. Assume the majority of people have at least 2.0 or above. Overcooling, bad design, and management are all common causes of this.

AKCP Power Usage Effectiveness Monitoring

AKCP launched a free online PUE calculator to check your data center efficiency and identify potential savings.

AKCPro Server is an ideal DCIM solution. Perfect for those people who don’t have the budget or need complex DCIM software, but require a capable monitoring system for their data center. With many advanced features such as Cabinet Thermal Mapping, Drill Down Mapping, Graphing, VPN connections to remote sites, AKCPro Server is the ideal choice. AKCPro Server is capable of live PUE calculations, so you can see real-time the effect changes you make have on your PUE.

By utilizing the AKCPro Server live PUE calculations you can see the immediate effect that changing your power usage has. Shut down fans and cooling systems and see how it improves your PUE. At the same time, use thermal rack maps to ensure that you are not overheating any servers. Adjusting the thermostat on your CRAC units will undoubtedly result in improved PUE, but what about its knock-on effect on the lifespan of servers?

By employing the complete AKCP ecosystem of products, Thermal Map Sensors, AKCPro Server and Power Meters work together to give a complete analysis and assistance in cutting your power costs and improving your PUE.

Reference Links:

https://davidmytton.blog/how-much-energy-do-data-centers-use/

https://energyinnovation.org/2020/03/17/how-much-energy-do-data-centers-really-use/

Clarissa GarciaThe Real Amount of Energy A Data Center Uses