
Modern data center managers are tasked with balancing data center uptime while also optimizing for efficiency and capacity utilization. They are constantly under pressure to accomplish more with less. They are increasingly relying on big data analytics to give the necessary insights to assess success and make sure business objectives are accomplished. It has never been simpler to view and evaluate this gathered data holistically thanks to networked smart devices like intelligent rack PDUs, busways, branch circuit meters, and UPSs that provide an abundance of power and environmental sensor data. With these systems, you can collect data center KPI.
However, do you know what to track, where to start, and what your objectives should be? We’ve prepared a list of the top 10 Key Performance Indicators (KPI) that all data center administrators should be monitoring to increase the general health and efficiency of their data centers based on our experience with hundreds of customers that participate in our worldwide user groups.
The ability to measure these data center KPIs and strategically use the information they reveal enables better-informed decision-making in all areas of data center management, including asset management, capacity planning, and energy optimization.
Capacity By Key Data Center Resource
When it comes to reserving space for the deployment of new IT equipment, utilizing power resources more effectively, cutting operational costs, and informing management when additional capacity is required, data center administrators must make the most educated and data-driven decisions possible. Making such judgments, therefore, requires having precise, up-to-date information on the physical space, electricity, cooling, and network connectivity capability. Monitor capacity at the site, room/floor, cabinet, and port levels for the broadest perspective.
Data Center Energy Cost

Photo Credit: blog.matthews.com.au
According to IDC, as performance improves, there is a global 9% annual increase in energy usage per server. The financial cost of energy used can make up to 50% of the total running costs for data centers, thus it must be carefully monitored and minimized. Track your energy use and expenditures by location, division, or applications/services, set reduction goals, charge users back, adhere to company sustainability and green policies, and gather energy rebates and carbon credits.
Change Requests By User, Stage, And Type
Up to 30% of servers in a typical data center environment are replaced yearly. Servers that are over five years old fail more frequently and cost 200 percent more to maintain than new servers. Simplifying the management of moves adds, and modifications for server and network equipment is crucial for upholding SLAs while enhancing the effectiveness and productivity of data center workers. Managers and operators of data centers should keep track of how many tickets, work orders, and change requests are submitted as well as who is submitting them, how far along they are, and the specific modifications that are being sought. You can guarantee work order quality and transparency to business users by tracking work that is done in the data center from creation to completion. This will also increase staff efficiency through better collaboration.
Available Cabinet And Floor Space Remaining
The secret to managing continuous data center development and optimization is intelligent space capacity planning. To determine how well you are using your space and to correlate the amount of space you have with your ability to deploy new devices, keep track of the available cabinet space in terms of open rack units, including contiguous rack units. To determine how much free space is available to deploy additional cabinets on the data center floor, you need also to keep track of the number of open cabinet slots on the remaining floor. The most realistic picture of the actual remaining space capacity is provided by including planned decommissions and upcoming planned deployments in your reporting.
Data-driven decision-making is made possible across all dimensions of data-center management, from asset management to capacity planning to energy efficiency, by strategically exploiting the intelligence gained from measuring these KPI.
Cabinets With Most Free Data Ports And Power Ports
Knowing the ideal location to reserve cabinet space for new equipment as well as which cabinets have available data and power port capacity is necessary to achieve effective usage of all cabinet resources. By keeping track of all accessible ports inside your cabinets, you can make the most of your physical network and power port capacity. Then, and only then, can you intelligently provide new servers and network equipment by identifying the best cabinets? You can make more educated capacity planning decisions, use power and network resources more effectively, and lower operational costs if you know which cabinets have the freest physical ports.
Peak Load Per Cabinet Over Last 30 Days
As data center power resources become more scarce, maintaining uptime and promoting efficient power usage battle for attention. To fully understand how much power is being utilized, how much is available, and where efficiency may be increased, data center administrators need a thorough picture of the situation. Setting warning and critical alert levels for cabinet-level loads and measuring active power from rack PDU inlet readings make sure you are alerted as soon as a problem arises and have time to take action before service is disrupted. As a bonus, you will be able to locate cabinets that have stranded power capacity in addition to increased uptime.
Cabinet Power Failover Redundancy Compliance
According to a survey by the Uptime Institute, 33% of participants reported that power failures were the leading source of downtime, and 80% said that the majority of outages could have been avoided. Managers of data centers are under increasing pressure to supply more power to cabinets that are jam-packed with technology that consumes a lot of it. Therefore, you must have power redundancy in place to guarantee that IT equipment always has access to power. Utilize predictive what-if analysis and reporting to test and monitor your cabinet power failover redundancy to reach 100% compliance. This will help to reduce downtime.
Power Usage Effectiveness (PUE)
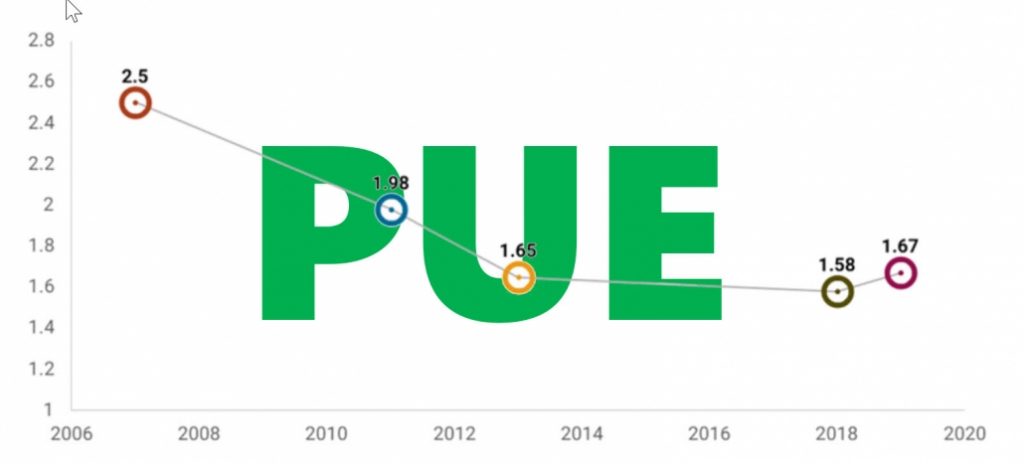
The most widely used KPI for reporting data center energy efficiency is PUE, a statistic created by the Green Grid Association. It is a ratio between the overall energy consumption of a facility and the energy supplied to IT devices. If you are relocating to a newer colocation facility or have a newer data center, you should aim for a PUE of less than 1.5, and even 1.2. If your PUE is abnormally high, applying energy efficiency best practices in your data center has the potential to significantly reduce costs. Track PUE over time to observe the effects of historical and seasonal efficiency variations.
Percentage Of Cabinets Compliant With ASHRAE Standards
Maintaining your temperature and humidity within the levels recommended by the American Society of Heating, Refrigerating, and Air-Conditioning Engineers (ASHRAE) can maximize energy efficiency and assure ideal climatic conditions for your IT equipment. By showing all sensor points in thermal envelopes within ASHRAE’s psychrometric charts, it is possible to use environmental sensors to detect hot areas, overcooling, and severe humidity levels. To achieve and maintain 100 percent compliance, keep track of the proportion of cabinets in your data center that adheres to ASHRAE standards.
Hot Spots Occurrence And Duration

Photo Credit: www.windchillengineering.com
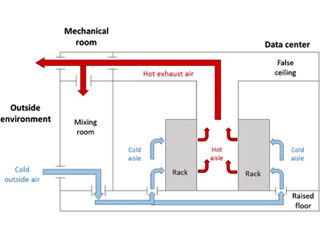
Hot spots, or areas at the inlet of IT equipment where inadequate cooling results in a temperature that is higher than what is safe, endanger the equipment and increase outages. Monitor and trend rack intake temperatures proactively in your data center environment to reduce the occurrence, extent, and duration of any hot spots that could affect your services. By ensuring elevated floor tiles are installed appropriately, utilizing the suitable tile perforation, adopting hot- and cold-aisle containment, placing racks and CRAC units in the ideal locations, and dispersing high-density servers around the data center, you can assist in resolving hot spots.
Data Center KPI Made Easy With AKCP Monitoring Solutions
How do you start tracking so many indicators when it’s more important than ever to integrate, analyze, and take action on the data center KPI that matter most to your data center? It is simple with a complete AKCPro Server Central Monitoring Software
These data center KPIs are available right out of the box with zero configuration dashboard widgets, reports, and visual analytics in a contemporary, second-generation DCIM platform. To ensure accurate, high-quality data that generate deeper, more trustworthy insights, an enterprise-class data, and health poller collects data directly from facility equipment. Data center experts can easily make better, more informed decisions with the help of second-generation DCIM, which also significantly simplifies capacity management.
Reference Links:
https://www.sunbirddcim.com/Top_40_Data_Center_KPIs
https://blog.se.com/datacenter/2012/03/02/data-center-key-performance-indicators-a-look-at-pue-and-other-numbers-to-evaluate-performance/
https://esj.com/articles/2012/12/03/data-center-kpis.aspx?m=1