
According to the Environmental Protection Agency (EPA), data centers consumed 2% (61 billion kWh) of total electricity usage in the United States in 2006. Surprisingly, IT equipment accounted for just half of this consumption; power and cooling infrastructure accounted for for the other half. Most attempts to minimize data center power usage have focused solely on the first side of the problem: the energy efficiency of processors and components used in IT equipment.
It is critical however to reduce the energy consumed by the cooling infrastructure in order to successfully reduce overall data center energy consumption. Organizations will be able to accept higher power densities without having to build more data centers by deploying intelligent cooling infrastructure. They will also save money on their power bill while reducing their carbon footprint.
Conventional Cooling Infrastructures Waste Substantial Energy
In a data center, the ambient temperature does not remain consistent throughout the data center floor. Temperature changes in both the vertical and horizontal planes. Depending on proximity to active or dormant equipment, airflow, and cooling systems. Furthermore, computer room air conditioners (CRAC) have cooling zones that commonly overlap, resulting in cooling redundancy. Simply said, many data centers waste a lot of energy cooling regions that are already cold.
The ability to pinpoint precise places where ambient temperature must be decreased or can be increased is essential for lowering data center power usage. This aim, as desirable as it is, has not been easy to achieve. The challenge of handling a huge number of temperature-measurement nodes leads to expensive and complex installation. As a result, multipoint temperature monitoring has not become mainstream.
Measuring Efficiency
Lowering power usage effectiveness (PUE) has been a top priority for data center operators for years. Simply explained, PUE is a ratio of a facility’s total power provided divided by the power used by its IT equipment, and everyone agrees that the lower the number, the better. A PUE of 1.0 represents a facility that is 100% efficient. In most cases, however, data centers average about 1.67, which indicates that only 1 watt of power is given to IT equipment for every 1.67 watts drawn by the facility.
The electricity used to run an entire data center is referred to as total facility power. The power required to run devices used to manage, route, store, or process data within a data center is known as IT equipment power.
These metrics give a baseline against which facility management may compare the power utilization of an installation to that of other data centers. The main issue is that there are several methods for calculating PUE, making it impossible to compare facilities.
A Comprehensive Approach
In order to measure data center efficiency, performance measurements that are more comprehensive than PUE are required. The main disadvantage of PUE is that it only analyzes the total efficiency of the building infrastructure that supports a data center, not the efficiency of the IT equipment. On the other side, IT efficiency is defined as a data center’s total IT output divided by the total input power to IT equipment.
But how can you monitor IT power consumption? IT efficiency may be precisely assessed once all power conversion, switching, and conditioning are completed, according to the Green Grid. As a result, the measuring point for total power provided to server racks should be at the output of the power distribution units (PDU).
IT output, on the other hand, refers to the data center’s genuine output in terms of the number of web pages served or apps supplied. IT output, in actual terms, indicates how well IT equipment produces usable output for given electrical power input. The amount of electricity used to power real IT equipment against how much is diverted to support systems like backup power and cooling is referred to as site infrastructure efficiency. These two graphs allow for the tracking of efficiency over time, as well as the identification of chances to increase IT output while lowering input power by eliminating losses and inefficiencies in support systems.
Minimizing Idle IT Equipment
IT equipment is typically underutilized in comparison to its capabilities. Servers, for example, are only used 5% to 15% of the time, CPUs 10 to 20% of the time, storage devices 20 to 40% of the time, and networking equipment 60 to 80% of the time.
However, even when such equipment is not in use, it consumes a large amount of the power it would use if it were in use. Indeed, even when doing nothing, a typical server uses 30 to 40% of its full power.
Virtualization Of Servers And Storage
Many dedicated servers and storage systems are inefficiently deployed for a single application throughout the industry just to preserve physical lines of demarcation. Virtualization, on the other hand, allows servers and storage systems to be combined on a single platform while preserving strict separation between operating systems, applications, data, and users.
Most apps can operate on separate “virtual machines” that share hardware behind the scenes with other programs. Virtualization has the potential to significantly improve hardware usage and reduce the number of power-hungry servers and storage devices in most data centers. It can also increase server utilization from an average of 10% to 20% to at least 50% to 60%.
Consolidating Servers, Storage, And Data Centers
Blade servers can assist promote consolidation at the server level since they deliver higher processing output per unit of electricity consumed. They can execute the same task with 20% to 40% less energy than standard rack servers.
Another possibility is to consolidate storage. Consolidating storage improves memory use while lowering power consumption since bigger disk drives are more energy efficient.
Last but not least, by consolidating idle data centers into a single site, operators may save a lot of money by combining cooling and backup systems to maintain demands.
In part because of a trend toward “hyper-scale facilities,” which are super-efficient thanks to an organized, standardized computing architecture that readily scales up to tens of thousands of servers, data center power use has stayed relatively constant over the last five years.
On average, one server in a hyperscale data center can replace 3.75 servers in a traditional data center. According to a 2016 research from the Lawrence Berkeley National Laboratory, if 80% of servers in small U.S. data centers were transferred to hyperscale facilities, energy consumption would decline by a quarter.
Managing The CPU Power Usage
 The central processor unit (CPU) consumes more than half of the energy necessary to run a server03 CPU. Chipmakers are working on more energy-efficient chipsets, while multi-core technology enables heavier loads to be processed with less power.
There are other more ways to reduce CPU power usage. Most CPUs offer power-management capabilities that reduce power usage by switching between several performance levels based on use. Outside of peak performance activities, the CPU can reduce energy consumption by dynamically lowering processor voltage and frequency.
When CPU use is varied, adaptive power management minimizes power usage without sacrificing processing capabilities, resulting in considerable savings.
Toward Improved Power Supplies
The power supply unit (PSU), which converts incoming alternating current (AC) to direct current (DC), uses around a quarter of the server’s total power budget, second only to the CPU. Another energy waste is the point-of-load voltage regulators, which convert 12V DC to the different DC voltages delivered to CPUs and many chipsets. Several industry standards exist to enhance the efficiency of server components, such as “Class 80+.”
Before reaching the IT equipment, electricity used by a data center facility often flows via an uninterruptible power supply (UPS) and power distribution units (PDU). PDU typically run at a high efficiency of 94% to 98%, hence UPS power conversion is the primary determinant of energy efficiency.
Focusing on peak efficiency while assessing a UPS, on the other hand, is deceptive because PDUs are unlikely to function at maximum capacity. Many IT systems, in fact, require twin power sources for redundancy, resulting in poor utilization rates of 20% to 40%. Experts rely on an efficiency curve 04 to give the complete picture and appropriately evaluate UPS systems in light of this. As a consequence of the work done in UPS power electronics, the efficiency curve has been shaped to be flatter and consistently higher across a wide range of loads.
Distributing Power At Higher Voltages
Virtually all IT equipment is designed to function with input power voltages ranging from 100V to 240V AC to comply with worldwide standards. The more voltage there is, the more efficient the device is. A server can be powered directly from a UPS with a 240/415V three-phase four-wire output power, resulting in a 2% decrease in facility energy.
Adopting Best Cooling Practices
 A data center’s cooling system accounts for 30% to 60% of the total power bill. Many institutions may be able to save money on cooling expenses by following well-established procedures. However, if the density of server racks continues to rise, it may be time to examine liquid cooling systems. At rack densities ranging from two to three kW per rack to 25 kW per rack, traditional air-cooling systems have shown to be quite successful at providing a safe, regulated environment. However, operators are now aiming to establish an atmosphere that can sustain densities of more than 30-50 kW, at which point air-cooling systems become ineffective. Alternative cooling systems, such as back door heat exchangers, may be able to help in certain situations.
Warming Up To Higher Ambient Temperature
Warming up to higher ambient temperature Server rooms are usually kept at an ambient temperature of around 22 °C, leading to air conditioning unit outlet temperatures of 15°C to 16°C. However, the American Society of Heating, Refrigerating and Air Conditioning Engineers (ASHRAE) recommends temperature ranges from 15°C to 32°C for most new devices, with a humidity tolerance of eight to 80%.
Plugging Into The Smart Grid
Smart grids allow for two-way energy and information transfers, resulting in a distributed, automated power distribution network. They have the potential to play a vital role in deepening the integration of renewable energy and distributed power generation. A smart grid can also deal with renewable energy variations with the aid of integrated monitoring and control, ensuring a continuous and steady power flow across the electrical grid.
Operators of data centers can not only use clean electricity from the grid, but they can also build renewable power generators on-site to serve as a backup power source. Generators and consumers can communicate in real-time, giving useful tools for receiving incentive-based supply or load reduction signals in an emergency.
Every Watt Matters
Every watt matters in terms of cost and stewardship. All of the small changes outlined above, when used together, may have a considerable energy-saving benefit.
AKCP PUE Calculation
The industry standard in Data Center Efficiency
Over 30 years of experience in professional sensor solutions. Measure your data center power consumption, rack inlet and exhaust temperatures, differential air pressure, and fine-tune your operation for maximum efficiency.
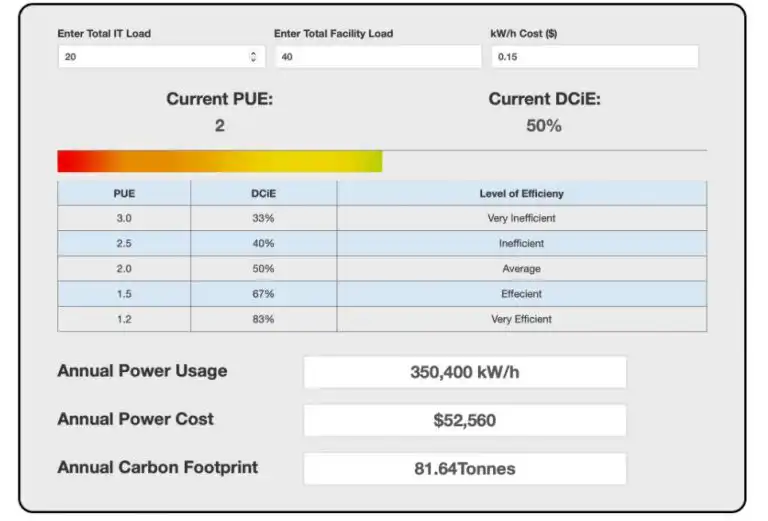
AKCPro Server shows live PUE calculations. Using power meters the total facility and IT loads are used as the input. The resulting PUE is displayed dynamically. As your facility loads change, the live PUE numbers will also update. Make changes in your facility and see instantly how much power you are saving. With the addition of cabinet thermal maps, you can ensure maximum PUE, while not violating ASHRAE recommended inlet air temperatures. Cabinet thermal maps also monitor the △T across the rack to ensure cooling is being utilized.
By monitoring PUE over a period of time, AKCPro Server creates a graph of your PUE. This allows data center managers to evaluate how changes have impacted PUE and measure improvements. By combining PUE metrics with other sensor data you can ensure maximum data center efficiency. Yes, you may have a great PUE of 1.25 but half your servers are sitting idle. What happens when they spool up? What about cooling capacity, is it being fully utilized? Are you running your data center too cold?
Try out our online PUE Calculation Tool here
By employing the complete AKCP ecosystem of products, Thermal Map Sensors, AKCPro Server and Power Meters work together to give a complete analysis and assistance in cutting your power costs and improving your PUE.
Reference Links:
https://www.maximintegrated.com/en/design/technical-documents/app-notes/4/4334.html
https://new.abb.com/news/detail/66580/how-data-centers-can-minimize-their-energy-use
https://www.colorado.edu/lab/sbs/doe-datacenter
- About the Author
- Latest Posts

For over two decades at AKCP, I have been focused on a single mission: bringing complete visibility, security, and efficiency to the world’s critical infrastructure.
I believe that in the modern data center, AI is only as good as the data it receives. My goal is to ensure facilities have the precise sensor facts needed to control AI opinions, ultimately reducing PUE, releasing stranded capacity, and ensuring maximum uptime.